What This Automation Does
This workflow solves the problem of slow and manual stock research by automating analysis and chart creation using a Telegram bot.
It handles voice and text queries, makes a stock chart, analyzes it with AI, and sends results back fast.
Traders get quick, easy-to-understand insights without spending hours searching or calculating.
The workflow accepts Telegram messages.
If voice, it transcribes to text using OpenAI.
Then, it calls a chart API to generate detailed stock charts.
AI models analyze charts for technical signals like RSI and candlestick patterns.
Results come back as images and text replies on Telegram.
Stocks can be saved in Airtable for scheduled batch reports.
What the Bot Actually Tells You — Buy & Sell Signals
Most traders don’t just want a chart. They want to know one thing:
should I buy, sell, or hold right now?
This is exactly what the AI delivers after analyzing your stock.
After you send a ticker like AAPL or TSLA, here’s what comes back
in your Telegram:
📈 BUY SIGNAL indicators the AI looks for:
→ RSI below 30 — stock is oversold, potential bounce incoming
→ Bullish candlestick patterns — hammer, morning star, engulfing
→ Price holding above key support levels
→ Volume spike confirming upward momentum
📉 SELL SIGNAL indicators the AI looks for:
→ RSI above 70 — stock is overbought, potential pullback
→ Bearish candlestick patterns — shooting star, evening star, doji
→ Price breaking below key support
→ Declining volume on upward moves — weak rally warning
⚠️ HOLD indicators:
→ RSI between 40–60 — neutral zone, no strong signal
→ Consolidation pattern — stock moving sideways
→ Mixed signals across indicators — AI flags uncertainty
Every analysis reply includes a plain-English summary so you know
exactly what the signals mean — no chart-reading experience needed.
Tools and Services Used
- Telegram Bot API: Receives user messages.
- OpenAI API: Transcribes voice to text and creates AI-driven stock analyses.
- External Chart Image API: Generates technical stock charts with indicators.
- Airtable: Stores user-saved ticker symbols for batch processing.
- n8n Automation Platform: Orchestrates all workflow nodes and logic.
Inputs, Processing, and Outputs
Inputs
- Text or voice messages sent to Telegram Bot.
- Scheduled trigger to process saved ticker lists from Airtable.
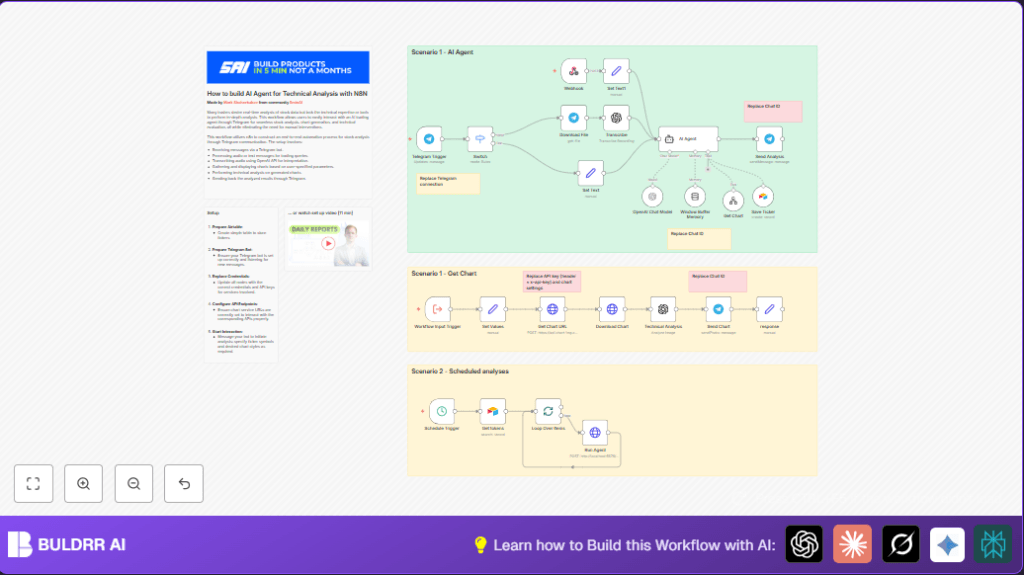
Processing Steps
- Detect message type with Switch node for voice or text.
- If voice, download audio, then transcribe to text using OpenAI.
- Extract stock ticker symbol from text.
- Send POST request to Chart API for a styled stock chart with technical overlays.
- Download the chart image.
- Send chart image to OpenAI for technical analysis: RSI, candlesticks, sentiment.
- Reply to Telegram with chart image and detailed analysis text.
- Save ticker symbol to Airtable for scheduled batch reports if requested.
- On schedule, loop through saved tickers, run the analysis workflow per ticker.
Outputs
- Telegram messages with stock chart images.
- Textual stock analysis messages from AI.
- Scheduled batch reports sent automatically.
Your Personal Stock Analysis Bot — Inside Telegram
Think of this as having a stock analysis bot available 24/7
directly inside your Telegram app.
No extra apps. No new dashboards. No subscriptions.
Just message your bot a ticker symbol — by text or even by voice —
and your personal stock bot responds with:
→ A full technical chart with RSI, candlestick overlays, and
volume indicators
→ An AI-written analysis of what the chart signals
→ A clear buy, sell, or hold summary in plain English
→ Automatic scheduled reports for your saved watchlist
It works like texting a friend who happens to be a professional
stock analyst — except it never sleeps, never charges per question,
and responds in seconds.
Who Should Use This Workflow
This is for active stock traders and analysts who spend much time manually searching and analyzing charts.
It helps those who want faster, automated stock insights via Telegram.
Also good for friends or groups needing quick, expert-level stock answers.
Beginner Step-by-Step: How to Use This Workflow in n8n
Importing and Setup
- Download the workflow file using the Download button on this page.
- Open the n8n Editor.
- Use “Import from File” to load the saved workflow.
Configuration
- Add all required credentials and API Keys: Telegram Bot, OpenAI, Chart API, Airtable.
- Update any IDs such as Telegram chat IDs, Airtable base/table, or other settings as needed.
- For HTTP Request nodes, ensure API keys and URLs are correct.
Testing and Activation
- Run the workflow manually to send a test message to your Telegram Bot.
- Check the bot’s response for correctness.
- If everything works, activate the workflow by turning it on in n8n.
- Consider using self-host n8n for better uptime if needed.
Customization Ideas
- Adjust chart style parameters in the Chart API node to different types like bar or line.
- Change stock exchange prefixes from NASDAQ to NYSE or others.
- Modify AI Agent prompts for tone or more disclaimers.
- Add more technical indicators like Bollinger Bands or MACD to the chart request.
- Set Telegram nodes to use dynamic chat IDs from incoming messages.
Troubleshooting
Common Problems and Solutions
- “API request failed” or empty chart: Check Chart API key and JSON body format.
- No message after sending voice: Confirm Telegram bot webhook and updates configuration.
- AI returns generic answers: Improve AI Agent system prompt and check token limits.
Pre-Production Checklist
- Confirm Telegram Bot webhook is active.
- Test both voice and text inputs.
- Verify Chart API call with a test.
- Confirm OpenAI keys and limits.
- Check Airtable permissions.
- Run the schedule trigger with a sample ticker list.
Summary
✓ Saves hours of manual stock research daily.
✓ Provides fast, clear stock chart images and AI analysis.
✓ Works via Telegram for easy access.
✓ Automates scheduled portfolio reporting.
✓ Easy to set up in n8n with download and import.
