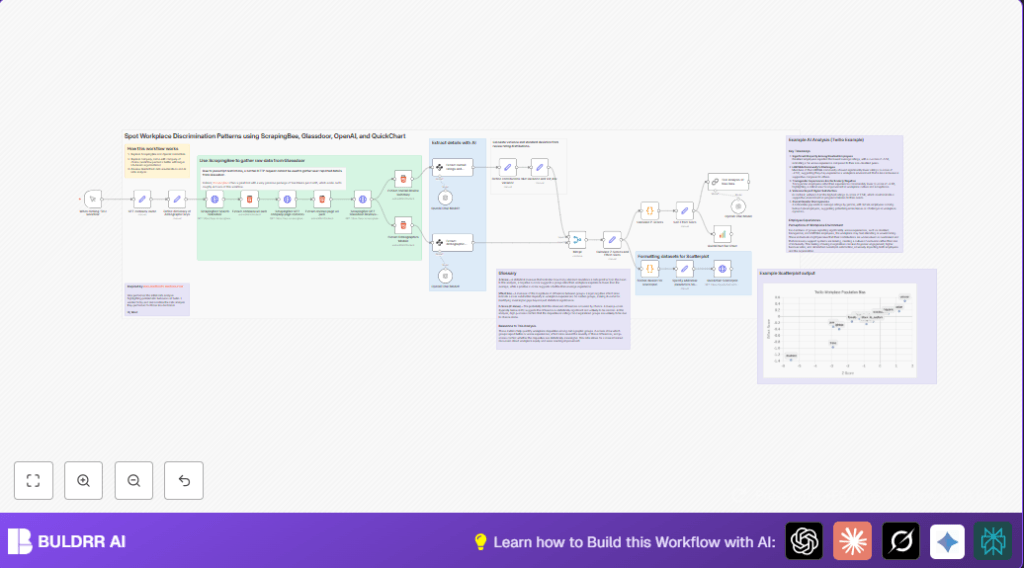
What this workflow does
This workflow finds unfair differences in company reviews by demographic groups.
It solves the problem of slow, manual checking of lots of unstructured Glassdoor data.
The outcome is clear charts and text that shows where some groups rate a workplace much better or worse than others.
You get quick, statistical insights to spot bias and discrimination.
The automation scrapes Glassdoor reviews using a proxy that handles JavaScript.
Then AI reads the messy HTML to pull out numbers and ratings for different people groups.
It calculates statistics like averages, z-scores, effect sizes, and significance p-values.
Charts display the important rating gaps visually.
Finally, AI writes a simple summary report explaining the bias patterns found.
Who should use this workflow
This is for HR analysts wanting fast, repeatable checks for workplace bias using real employee reviews.
It helps teams avoid guesswork and saves hours otherwise spent scraping and crunching data by hand.
Ideal for those who understand company diversity concerns but lack time or advanced stats tools to analyze raw review data deeply.
Tools and services used
- n8n automation platform: Runs the entire workflow and connects parts.
- ScrapingBee API: Fetches Glassdoor pages by bypassing JavaScript blocks.
- OpenAI API with ChatGPT models: Extracts key info from review HTML content using AI.
- QuickChart API: Creates bar and scatterplot charts from stats data.
- JavaScript Code node in n8n: Calculates p-values and reformats data.
Inputs, Processing Steps, and Outputs
Inputs
- Company name (like Twilio) entered in a Set node.
- API keys for ScrapingBee and OpenAI.
Processing Steps
- Search Glassdoor via ScrapingBee and extract company profile URL.
- Fetch company and review page HTML using ScrapingBee requests.
- Extract overall ratings and demographics HTML blocks by parsing the pages.
- Use OpenAI AI to pull numeric average ratings, counts, and star distributions from HTML text.
- Calculate variance and standard deviation from rating counts with Set nodes.
- Merge overall and group data for unified statistical analysis.
- Compute z-scores and effect sizes to measure group rating differences.
- Use JavaScript in Code node to calculate p-values showing statistical significance.
- Sort data and prepare datasets formatted exactly for chart generation.
- Create bar chart and scatterplot images using QuickChart API calls.
- Generate human-friendly bias report text with AI summarizing findings.
Outputs
- Bar chart image showing effect sizes by demographic group.
- Scatterplot image showing z-score versus effect size to highlight bias patterns.
- AI-written text explaining key disparities and workplace experiences for leadership.
Beginner step-by-step: How to use this workflow in n8n for production
Download and import workflow
- On this page, find and click the Download button to get the workflow file.
- Open the n8n editor where you want to run the automation.
- Choose Import from File and upload the downloaded workflow JSON.
Configure necessary credentials and inputs
- Add API Key credentials for ScrapingBee and OpenAI via the n8n credentials manager.
- Edit the SET company_name node to enter the exact company to analyze.
- Update any email addresses, folder IDs, or other fields if you connected the workflow to other services.
Test and activate workflow
- Run the workflow manually using the Manual Trigger node once to check all steps complete without errors.
- Inspect outputs, charts, and AI summaries to verify data looks correct.
- If all good, activate the workflow in n8n so it can run on-demand or scheduled as preferred.
- Consider setting alerts for node failures to detect API or layout issues quickly.
If using self-host n8n or running n8n on server, check credential security and keep the instance updated.
You can find help on self-host n8n.
Customization ideas
- Change the company by editing SET company_name node value.
- Add or remove demographic groups by modifying the dictionary keys in the relevant Set node.
- Adjust statistical significance thresholds or effect size filters by editing the JavaScript in the p-value Code node.
- Switch scraping provider by replacing ScrapingBee HTTP request nodes with another proxy service, updating credentials accordingly.
- Change chart colors or styles by editing JSON options in QuickChart nodes for branding match.
Common issues and troubleshooting
Problem: Empty or error responses from ScrapingBee API
Cause could be invalid API key, exceeding token usage, or Glassdoor website changes blocking scraping.
Solution: Verify API credentials, check token quotas, update URL paths or CSS selectors in extraction nodes.
Problem: AI extraction nodes give zero or incomplete data on demographics
Cause might be wrong input HTML or missing labels that AI expects.
Solution: Confirm extracted HTML matches expected content. Try adjusting AI prompt or nodes reading the HTML.
Problem: Charts show blank or broken data
Cause is likely data formatting errors before sending to chart API.
Solution: Review Code node formatting logic and ensure numeric rating variables are properly referenced.
Summary
✓ Detects and measures workplace rating bias across demographics using real Glassdoor reviews.
✓ Automates tedious scraping, parsing, and statistical calculations for HR professionals.
✓ Produces clear charts and AI-written reports helping leadership understand disparities.
✓ Saves hours and improves accuracy over manual review analysis methods.
✓ Flexible for many companies and easily customized for specific needs.
→ You get reliable, visual, and text insights to guide actions improving workplace equity.
→ The workflow integrates HTTP scraping, AI text extraction, stats math, chart generation, and language models in a simple pipeline.
→ Configurable and ready for importing into any n8n instance, including self-host n8n setups.
