

What This Automation Does ⚙️
This workflow takes sales data in JSON form and makes a line chart picture automatically using n8n.
It stops you from manually making charts and saves time uploading the picture to Google Drive.
The end result is a ready-made chart image stored in a chosen Drive folder, cutting chances for mistakes.
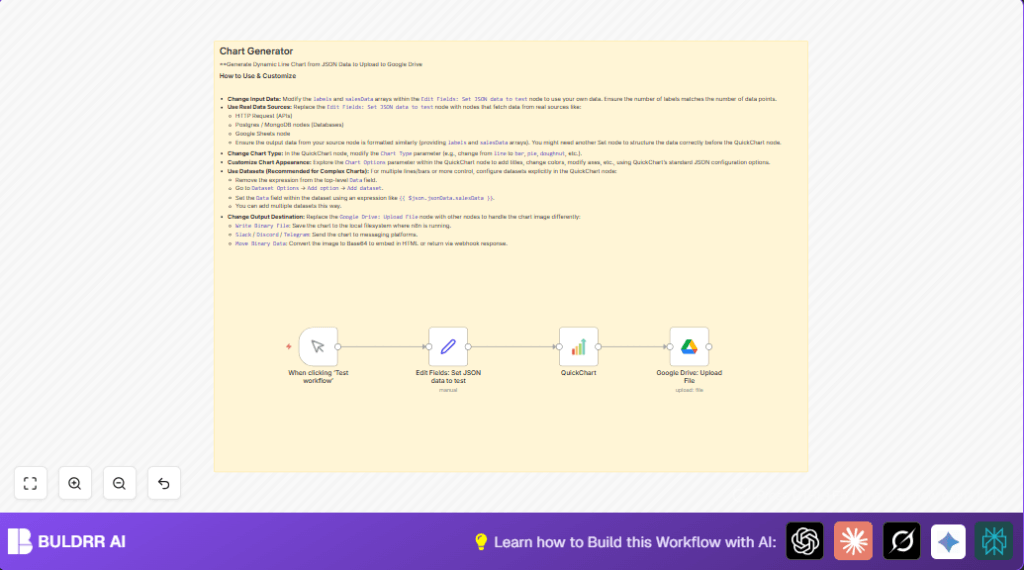
The workflow inputs quarterly sales numbers and labels from JSON. It processes the data with the QuickChart node to create the line chart image. Then it uploads that image file to Google Drive using Google Drive node.
You get a visual graph ready to share without opening any software or copying files yourself.
Tools and Services Used
- n8n: To build and run the automation workflow.
- QuickChart node: To generate chart images from JSON data.
- Google Drive node: To store the generated chart image online.
- Google Drive account and OAuth2 credentials: Configured in n8n for secure uploading.
Inputs, Processing Steps, and Output
Inputs
- Quarterly sales numbers as a JSON array.
- Labels for the X-axis periods in JSON array.
- Report title as a JSON string (optional for naming or title purposes).
Processing Steps
- JSON data is set in the Set node containing sales figures and labels.
- The QuickChart node reads this data via expressions to build a line chart.
- The line chart image is created dynamically and output as binary data.
- The Google Drive node receives the image file and uploads it into the specified Drive folder.
Output
An image file of the quarterly sales line chart appears in the indicated Google Drive folder.
Who Should Use This Workflow
Anyone who wants to automate making line charts from sales or other data that comes in JSON format.
It is useful if you want fast, error-free, repeatable chart generation and direct storage without manually handling files.
This is helpful for non-technical users if they follow simple setup steps or for tech users who want to add data sources later.
Beginner Step-by-Step: How to Use This Workflow in n8n
Import the Workflow
- Download this workflow file by pressing the Download button on this page.
- Open n8n editor and select “Import from File”.
- Choose the downloaded workflow file to add it to your n8n workspace.
Configure the Workflow
- Add your Google Drive OAuth2 credentials inside n8n if not already configured.
- Set the Google Drive Folder ID where the chart images should be saved. Change it from default if needed.
- Check the Set node JSON data if you want to update test sales numbers or labels.
Test and Activate
- Run the workflow manually using the Manual Trigger node to confirm it creates and uploads the chart.
- Look in your Google Drive folder for the new chart image file.
- If test is successful, toggle the workflow status to “active” to run automatically or connect to other triggers.
This method works once you are inside n8n editor. You do not build the workflow manually here. Import and configure only.
For self hosting n8n, visit self-host n8n for details.
Key Expressions Used in the Workflow
The workflow uses expressions to pick data dynamically from JSON, for example:
{{ $json.jsonData.salesData }}This is the path to the sales numbers array.
{{ $json.jsonData.labels }}This gets the X-axis labels array.
Names the uploaded file using:
=chart.{{ $binary.data.fileExtension }}This adds the right image extension automatically.
Common Problems and Fixes ????
Empty or broken chart image
This happens when label array and sales data array lengths do not match.
Check your JSON carefully. Both arrays must be same length exactly.
Google Drive upload permission error
Make sure Google Drive OAuth2 credentials are authorized and working.
Verify folder permissions allow file uploads.
Customization Ideas ✏️
- Change chart type to bar, pie, or others inside QuickChart node.
- Replace the static Set node with live data from HTTP Request or database nodes.
- Add chart options JSON inside QuickChart node to style the chart with titles, colors, and scales.
- Switch uploading destination, use local file saving or messaging platforms instead of Google Drive.
Pre-Production Checklist ✅
- Confirm JSON data structure matches what QuickChart expects.
- Validate Google Drive OAuth2 credentials have correct permissions.
- Test the workflow manually before scheduling or production.
- Check uploaded chart image for correctness in Google Drive.
Deployment Guide
Turn on the workflow in n8n after testing is successful.
Use Manual Trigger for one time runs or add a schedule trigger for automated runs (like quarterly).
Check workflow runs and error logs in n8n dashboard.
Set up notification nodes to get alerts on failures if necessary.
Summary
✓ Saves time by automating chart creation and upload tasks.
✓ Removes errors from manual chart making and file management.
✓ Provides a clear line chart image of quarterly sales data.
✓ Is easy to configure and run using n8n.
✓ Can be adapted for different data or chart types.
